FMI U.S. Engineering and Construction Outlook:Third Quarter 2019 Report
Key Takeaways
Total Construction Put in Place
Estimated for the United States
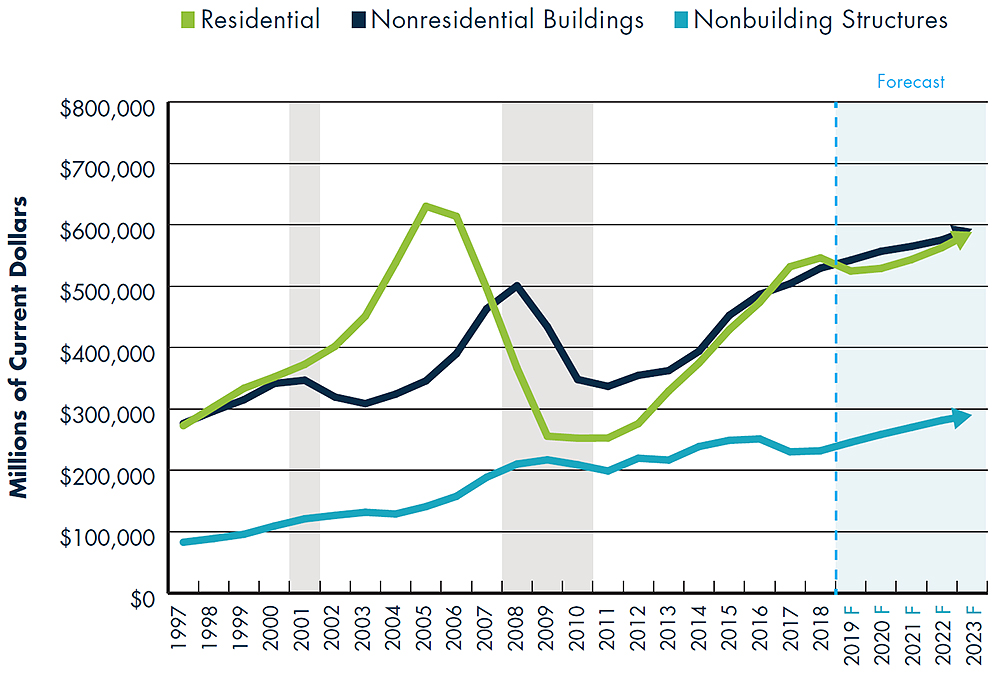
Throughout the value of construction put in place includes the cost of architectural and engineering work.
Source: U.S. Census and FMI Forecast
Total Construction Spending Put in Place 2018 and Forecast Growth
(2018-2023 CAGR) by Metropolitan Statistical Area
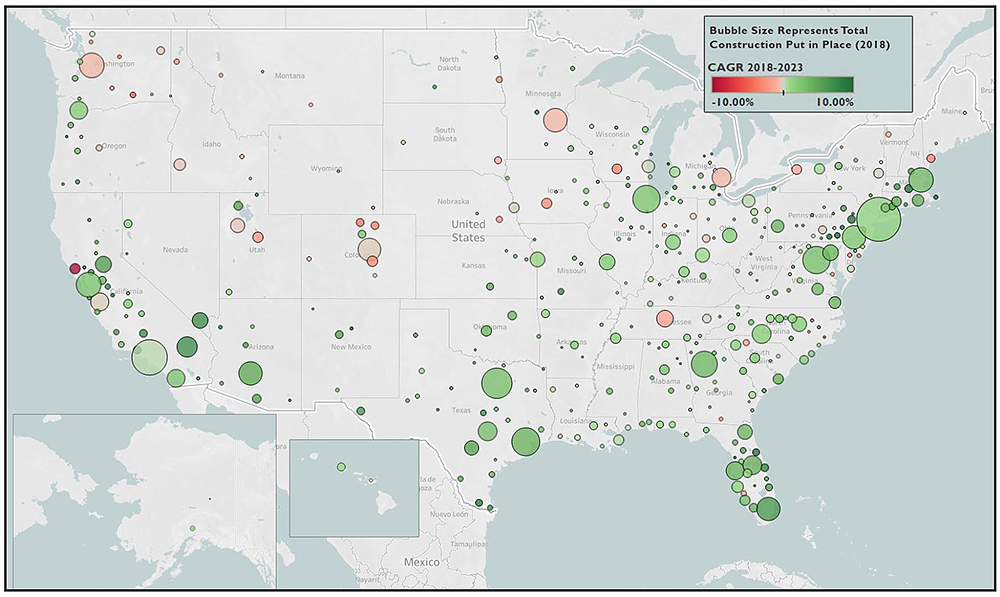
Source: U.S. Census and FMI Forecast
Residential Construction Put in Place
Single-Family Residential
- Economic climate is expected to remain rocky into the 2020 election cycle
- Affordability and availability issues prevail despite falling interest rates and rising wages
- Builders challenged in delivering lower-cost starter homes
Drivers: Unemployment rate, core CPI, income, mortgage rate, home prices, housing starts, housing permits
Multifamily Residential
- Foreign direct investment in real estate has slowed
- Urbanization and generational buyer trends continue to drive long-term opportunities
- Buyers and renters are increasingly transient in both living and in employment obligations
Drivers: Unemployment rate, core CPI, income, mortgage rate, home prices, housing starts, housing permits
Improvements
- Home price appreciation has moderated in many major metropolitans, balancing investment-led decisions
- Lower borrowing costs are expected to support increased refinance and improvements
- Aging inventories on top of increasing rental and flipping activity; rental turnover is slowly declining
Drivers: Unemployment rate, core CPI, income, mortgage rate, home prices, housing starts, housing permits
Nonresidential Construction Index (NRCI) Scores
Q1 2011 to Q4 2019
(Scores above 50 indicate expansion; scores below 50 indicate contraction)
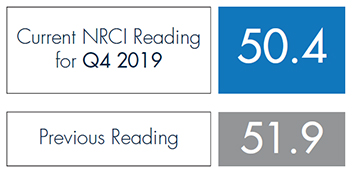 NRCI scores are based on a diffusion index where scores above 50 represent improving or expanding industry conditions, a score of 50 represents conditions remaining the same, and a score below 50 represents worse conditions than last quarter (or contraction).
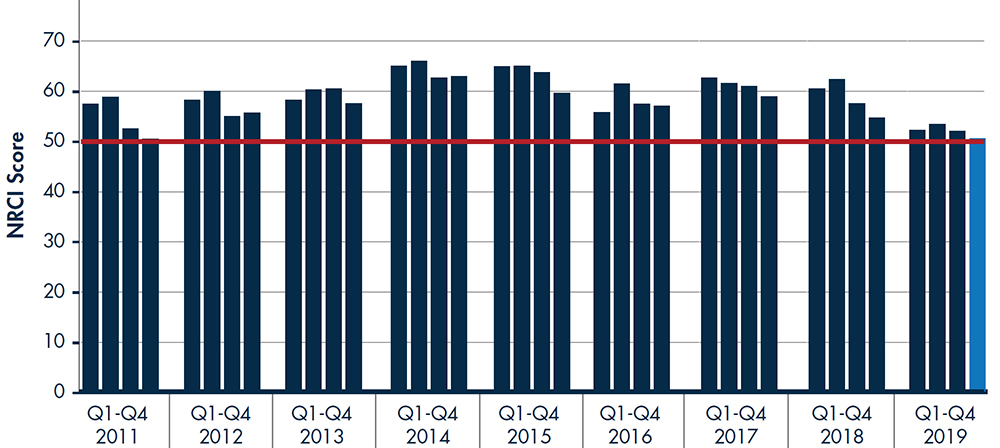
The data in the NRCI is presented as a sampling of construction industry executives voluntarily serving as panelists for this FMI survey. Responses are based on their experience and opinions, and the analysis is based on FMI’s interpretation of the aggregated results.
Nonresidential Construction Put in Place

Lodging
- Business travel, RevPar and occupancy rates are expected to remain healthy through 2020
- Occupancy is starting to balance alongside ongoing added supply and slowing employment growth
- Another round of casinos in the pipeline in addition to significant transportation projects indicate support for long-term elevated spending in select markets
Drivers: Occupancy rate, RevPAR, average daily rate, room starts

Office
-
- Office vacancy rates at lowest levels in 18 years
- Downtown markets are experiencing large increases in rents
- Widespread labor constraints and slowed employment growth are expected to weigh on future spending
- Demand for data center investment continues to expand rapidly
Drivers: Office vacancy rate, unemployment rate
Commercial
- Continuing rise in e-commerce with big-box home improvement retailers announcing major investments
- Demand for warehouse and distribution continues to expand with facilities servicing a mix of core trades routes and last-mile logistics; strong U.S. dollar supports increased imports
- Brick-and-mortar retail continues to evolve and shift into mixed markets, including travel, leisure and entertainment
Drivers: Retail sales, CPI, income, home prices, housing starts, housing prices
Health Care
- Increasing private investor interest in medical office buildings and specialty care facilities
- Within the next decade all baby boomers will be 65 or older
- New technologies and services (e.g., telehealth and wearables) are expected to temper demand for long-term care facilities and traditional hospitals
Drivers: Population change, population change in ages 75 and up, uninsured population, government spending, nonresidential structure investment
Educational
- Maintenance needs and backlogs are outpacing tax revenues and local bonding support
- Increasing percentage of the U.S. population under 18 years old
- K-12 spending growth expected to outpace college/university
- Safety becoming a core element of facility design and demand for renovation expenditures
Drivers: Population change younger than age 18, population change ages 18-24, stock markets, government spending, nonresidential structure investment
Religious
- Lean design and delivery teams are combining more community/gathering spaces with a return to value-led traditional architecture
- Increased wages and income levels bolster industry revenue growth
- Declining share of Americans donating to religious organizations alongside declining attendance over time
Drivers: GDP, population, income, personal savings

Public Safety
- Rising tax revenues and local bond support
- High-growth metropolitans are in need of updated facilities and infrastructure
- National crime rates are trending downward
Drivers: Population, government spending, incarceration rate, nonresidential structure investment

Amusement and Recreation
- Rising employment, business travel and transportation infrastructure support continued investment
- Demand for sports and convention centers moderates into 2020
- Smaller-scale investments look to available retail space for opportunities
- Second wave of large casinos appears in planning and development stages
Drivers: Income, personal savings rate, unemployment rate, employment
![]()
Transportation
- Urbanization, e-commerce, high business spending and an increasingly geographically flexible workforce are all trends driving demand for increased connectivity
- Expect a growing number of megaprojects in airport and transit systems through the forecast period
- Addressing urban crowding is a means to continue attraction (and investment) in large, high-growth metropolitans
Drivers: Population, government spending, transportation funding
Communication
- Led by Verizon, fifth-generation (5G) infrastructure is being deployed rapidly across major metropolitans
- Current outline of T-Mobile and Sprint merger would further accelerate 5G rollout while also reshaping the wireless industry
- Bandwidth and fiber needs remain high; providers are working to bring new capacity online in efforts to keep up with the public demand
Drivers: Population, security/regulation standards, private investment, innovation/technology investment
Manufacturing
- Trade tensions, new tariffs and oil price volatility continue to generate uncertainty, resulting in wavering consumer sentiment
- Increased business investment tied to domestic oil and gas production and chemical manufacturing, especially along the Gulf Coast
- Continued softening in industrial production expected into 2020; consumer spending and business inventories are up
Drivers: PMI, industrial production, capacity utilization, durable goods orders, manufacturing inventories
Nonbuilding Structures Construction Put in Place

Power
- Pipeline activity will remain active well into 2020 (and beyond); significant investments will continue to face opposition in addition to mounting risk related to our trade climate
- Targeted renewable energy goals should drive significant investment in both generation and connectivity of those sources
- Trends toward electrification (e.g., electric cars) are increasing both metropolitan and suburban infrastructure requirements
Drivers: Population, industrial production, government spending

Highway and Street
- Expanding state and local economies have led to increased funding sources; overall growth is driven by a handful of the largest states (e.g. California’s SB1)
- Efforts are underway to repeal a $7.6 billion federal funding rescission scheduled for mid-2020, the rescission could potentially impact contracting authority available to states nationwide
- A 2020 expiration of the Fixing America's Surface Transportation, or FAST Act, the current multiyear federal funding and authorization bill, is expected to gain attention of political platforms in the upcoming presidential election
Drivers: Population, government spending, nonresidential structure investment

Sewage and Waste Disposal
- Passage of America’s Water Infrastructure Act in late 2018 and reauthorization of the Water Infrastructure Finance and Innovation Act (WIFIA) provide a substantial boost in funding
- Residential needs and technology advancements will drive overall demand
Drivers: Population, industrial production, government spending

Water Supply
- Passage of America’s Water Infrastructure Act in late 2018 and reauthorization of the Water Infrastructure Finance and Innovation Act (WIFIA) provide a substantial boost in funding
- Recent introduction of the Water Quality Protection and Jobs Creation Act of 2019 further supports ongoing clean water supply infrastructure spending
Drivers: Population, industrial production, government spending

Conservation and Development
- USACE spending is being aided from various sources, including a recent 2019 Disaster Relief bill, the 2019 federal spending package and the 2018 Consolidated Appropriations Bill
- The Senate recently approved hikes for USACE’s 2020 spending appropriations, reversing the deep cuts previously found in the Trump Administration’s proposal, while also likely extending negotiations
- Trump administration repeals 2015 Clean Water Rule which determines permitting requirements
Drivers: Population, government spending
 Jay Bowman is a managing director with FMI. Jay assists a broad range of stakeholders in the construction industry, from program managers and general contractors to specialty trades and materials producers, with the identification and assessment of the risks influencing the strategic and tactical decisions they face. In this role, Jay’s primary responsibilities include research design and interpretation, based on developing an understanding of the context within which these organizations operate. Jay can be reached at [email protected].
 Brian Strawberry is a senior economist with FMI. Brian’s expertise is in economic and statistical modeling. He leads FMI’s efforts in market sizing, forecasting, and building product/construction material pricing and consumption trends. The combination of Brian’s analytical skills and creative problem-solving abilities has proven valuable for many contractors, owners and private equity groups as well as industry associations and internal research initiatives. Brian can be reached at [email protected].
Did you enjoy this article? Subscribe here for more FMI content.